The group’s research focuses on the synthesis, characterization and optimization of a broad range of solid-state compounds.
Materials
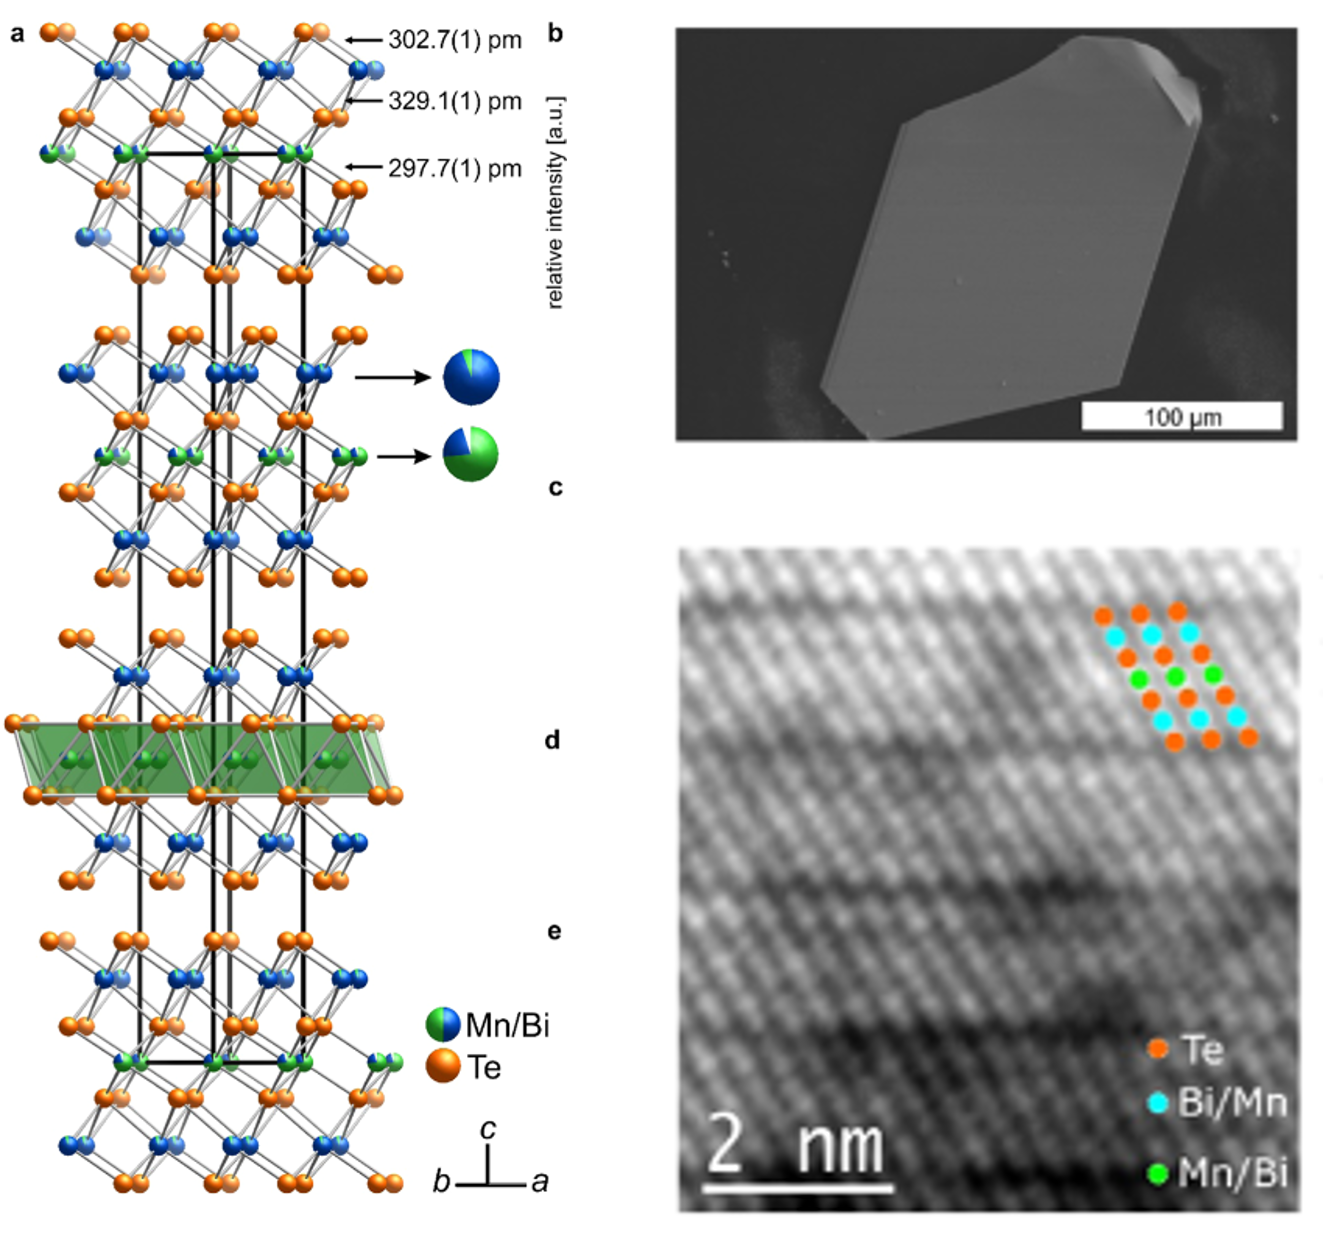
- materials based on GeTe, PbTe, Ge/Sb/Te or Ge/Bi/Te with high thermoelectric performance
- layered structures with intrinsic defects on various length scales
- thermoelectric performance optimized by targeted doping
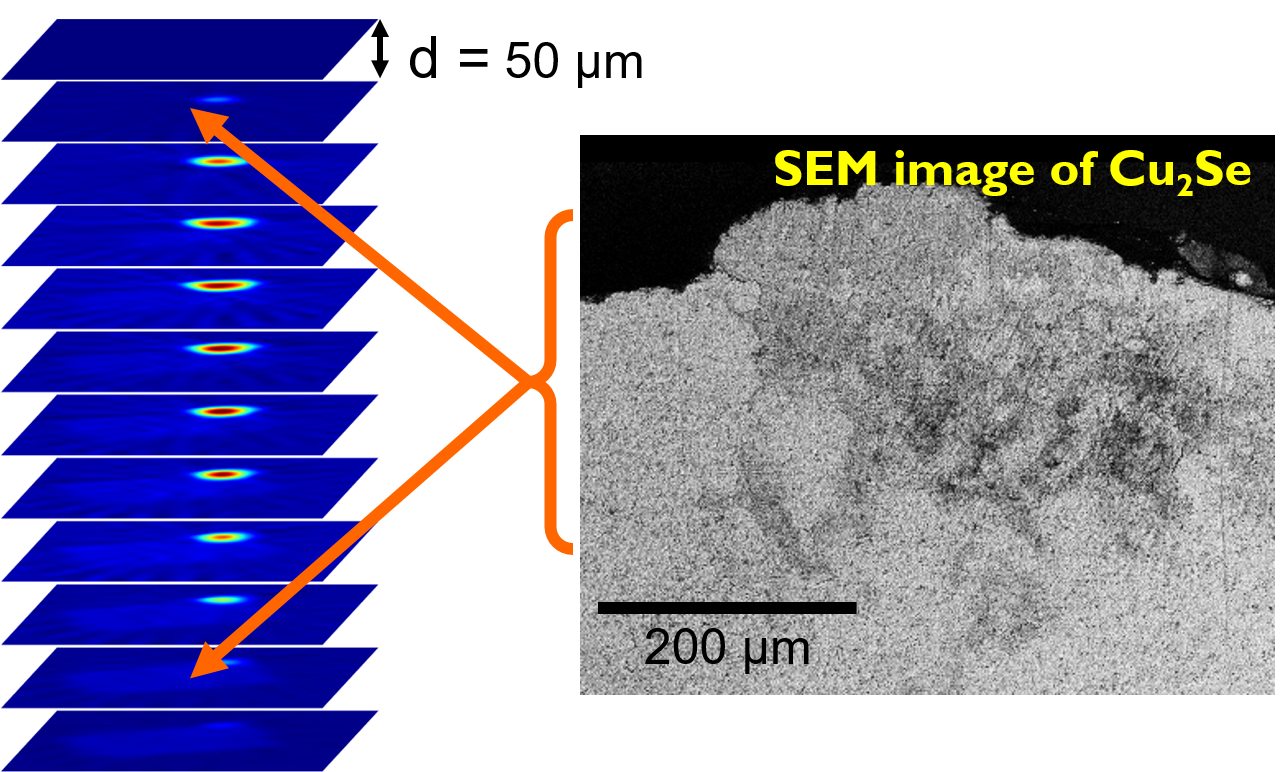
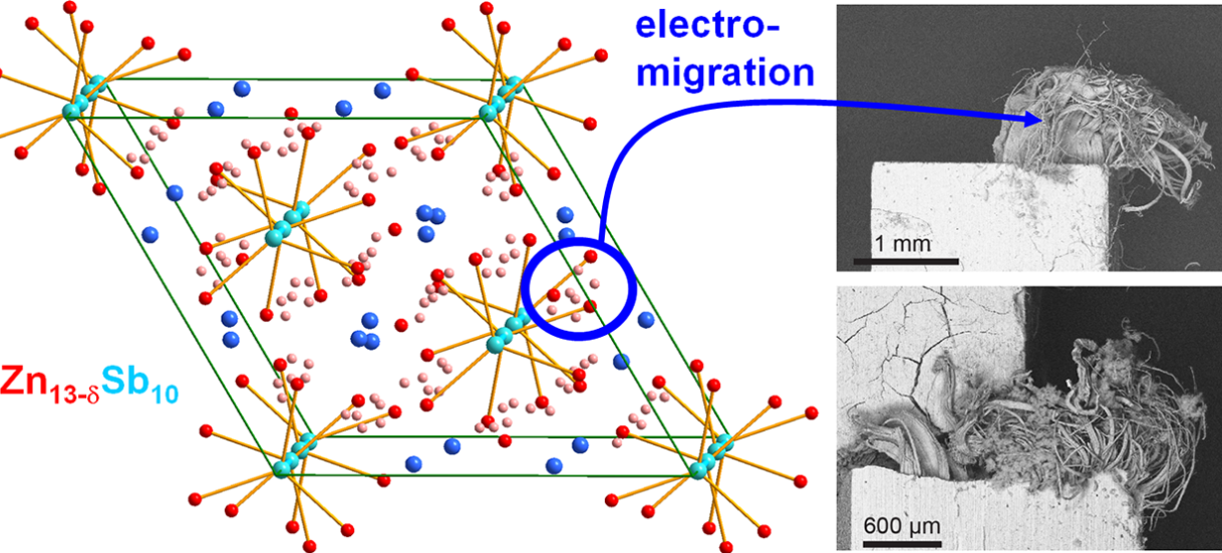
- mixed ionic-electronic conductors: Zn13-δSb10 , Cu2Se, and AgCrSe2 with high thermoelectric performance, but ionic conductivity leads to decomposition under electrical fields
- X-ray diffraction computed tomography (3D-XRDCT) in situ
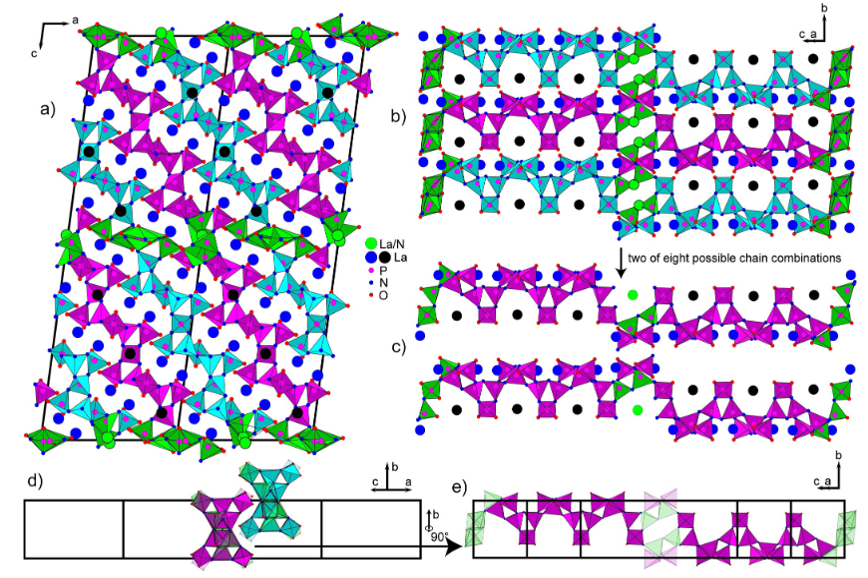
- diverse structural chemistry of nitridic frameworks with condensed SiN4, PN4, Si(N,O)4 and P(N,O)4 tetrahedra
- doping with Eu2+ or Ce3+ ⇒ luminescence materials for LEDs
![enlarge the image: Excitation and photoluminescence spectra and crystal structure of (Lu/Y)Ba2[Si12O2N16C3]:Eu2+ with network of SiC(O/N)3 tetrahedra (Figure: Dr. C. Benndorf)](/fileadmin/Fakult%C3%A4t_Chemie/Institute/IMKM/OEC/LuYBa2_Si12O2N16C3_Eu2_.png)
Project of Dr. C. Benndorf
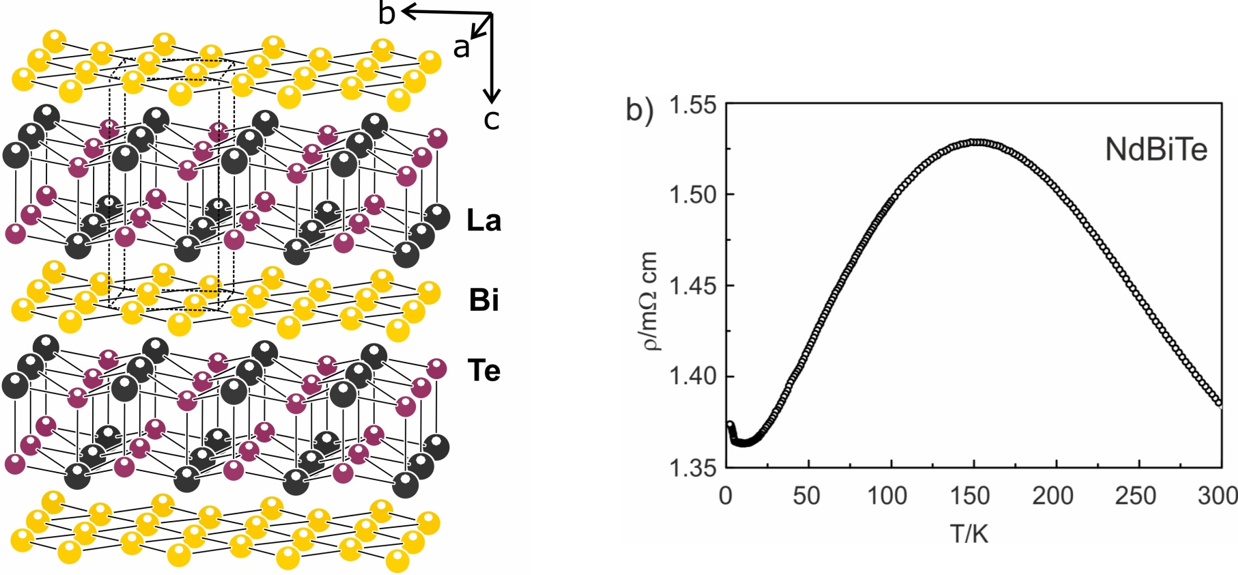
- layered mixed-anionic compounds like RESbS and REBiTe with square-like arrangement of Sb and Bi atoms
- CDWs examined by low-temperature diffraction, electron microscopy and spectroscopy
- stacking faults and diffuse scattering of BeP2 and BeAs2
- structure determination by combination of synchrotron and electron diffraction, bonding analysis with DFT calculations
![enlarge the image: Diffuse reflections and different stacking modes of layers of [As8]8- rings in BeAs2 (Figure: Dr. C. Benndorf)](/fileadmin/Fakult%C3%A4t_Chemie/Institute/IMKM/OEC/diffuse_scattering.png)
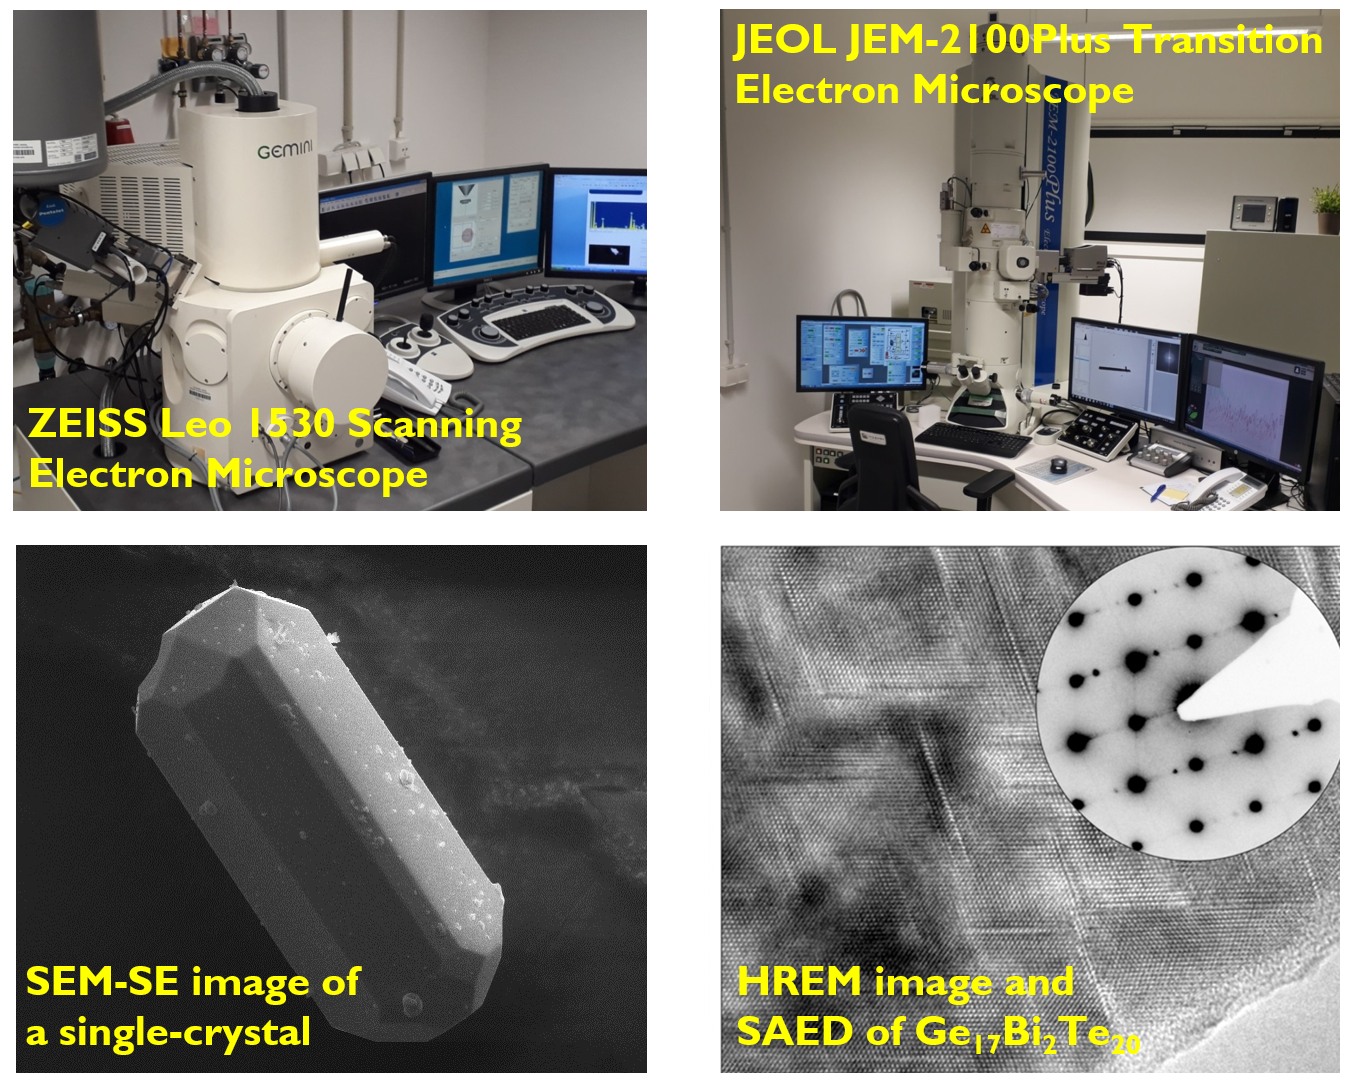
Methods
- SEM imaging and EDX spectroscopy ⇒ chemical analysis, microstructure of composite materials
- HRTEM imaging and electron crystallography ⇒ structure determination of nanocrystals
- single-crystal and powder diffraction
- micro-focused synchrotron beams ⇒ micro-/nano-crystals
- diffuse scattering, resonant diffraction, and more…

- modern solid-state synthesis
- high-temperatures
- inert conditions
- melt-spinning and high-frequency induction
- chemical vapor transport
- hydrothermal conditions
- flux-assisted synthesis
- …

- electrical conductivity and Seebeck coefficient (LSR)
- thermal conductivity and heat capacity (LFA)
